Value driver tree generator
A macro-enabled Excel file to help you easily create value driver trees (VDTs) in Excel and Powerpoint
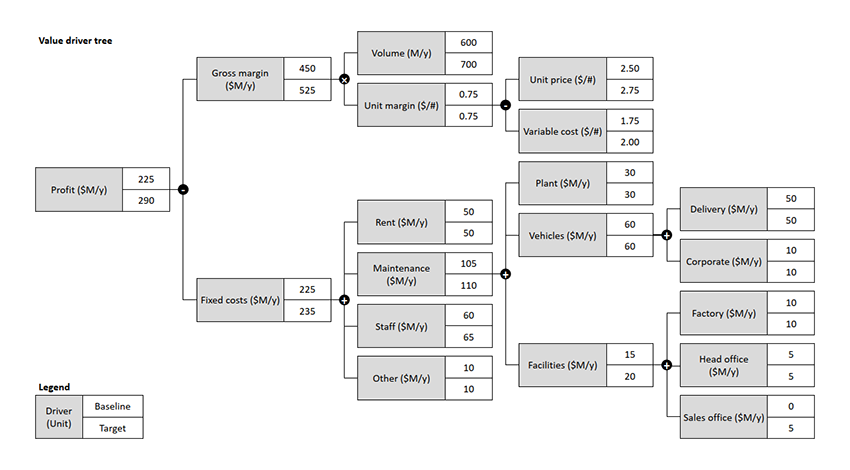
Example of a Powerpoint value driver tree generated by this tool.
Value driver trees, or VDTs, are a useful way to show the relationship between controllable business inputs
(e.g. for a factory, downtime between production runs) and desired business outcomes (e.g. profit).
I often use them to communicate the business value of an improvement idea. Showing the logic behind an estimate
of business value in a graphical format is transparent, trusted, and executive-friendly in a way that a
hand-written calculation or Excel spreadsheet is not.
However it is painfully repetitive to produce these diagrams in a workplace where Excel and Powerpoint are only
tools available for content creation.
Drawing rectangles, adding text, formatting connectors,
aligning shapes... then doing it all over again to incorporate last minute changes.
This tool shortcuts this tedium by quickly generating polished, editable VDT diagrams in Excel or Powerpoint,
based on the user's spreadsheet data and a handful of configuration settings.
Using this tool reduces the time to produce polished, editable VDT diagrams in Excel or Powerpoint, from hours to seconds.
There are only three inputs required to get started - the name of the worksheet containing the input data, the row in
which the data starts, and the scenarios to display on the VDT diagram.
The tool requires the input data to conform to a particular structure, described within the tool itself. The easiest way
to get started is to click the 'Generate new input' button and replace the dummy data with your own.
One thing to watch out for is the Scope column on the input data sheet. Use this to describe what portion of the tree
to include in the generated diagram, as shown below.
- Enter 'Root' in the row you want the VDT diagram to start (i.e. the root of the tree)
- Enter 'Trim' in any rows you want the VDT diagram to hide any further detail (i.e. trimming the tree branches)
Note that the nodes in the generated Excel VDT diagrams can be double-clicked to toggle the display of further detail. This works by adding and removing 'Trim' entries in the input data sheet's 'Scope' column, and redrawing the tree.
Double-click nodes within the generated Excel VDT diagram to toggle between hiding/showing further detail beyond that node.
There are additional configuration options to change the appearance of the generated VDTs. They should be self-explanatory,
so have a play around with them to see how they work.
Two of these configuration options are particularly useful:
- Set 'Tree display type' to 'Compact' to condense white space within the tree, useful when you are trying to fit a large tree with lots of branches into a relatively small space. Use the 'Spaced' option to draw each left-most input node on its own row. This takes up more vertical space but is useful when you need the space to annotate the input nodes.
- Set 'Mathematical operator type' to 'Round' to draw attractive circular mathematical operators at each junction to describe the relationship between related noes. However, these deform when resizing the diagram in Powerpoint. To address this, use the 'Offset' option to draw these operators off to the side and with a transparent background that deforms more gracefully.
The 'Tree display type' and 'Mathematical operator type' options are particularly useful when you have limited space to show lots of detail, or need to stretch/deform the Powerpoint diagram to fit within an existing slide.
This tool has served me well over the past couple of years.
If you find yourself feverishly producing similar VDT diagrams, perhaps thanklessly and under tight deadlines, please give it a go.
P.S. The VBA under the hood is not attractive. It has been cludged together by a hobbyist with scraps of VBA knowledge
retained from years ago.
Let me know if you have any improvement suggestions.